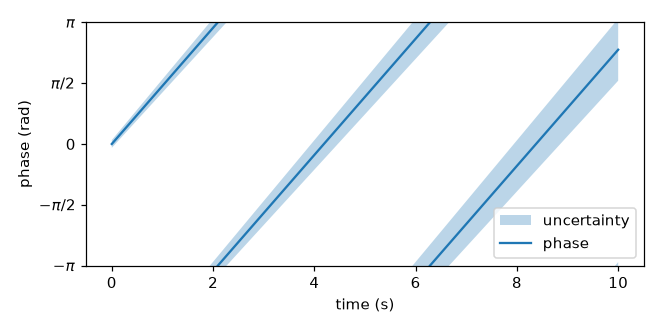
Matplotlib helper functions for plotting wrapped, angular, or periodic data: angles, phases, times of day, longitudes, and anything else that repeats or rotates.
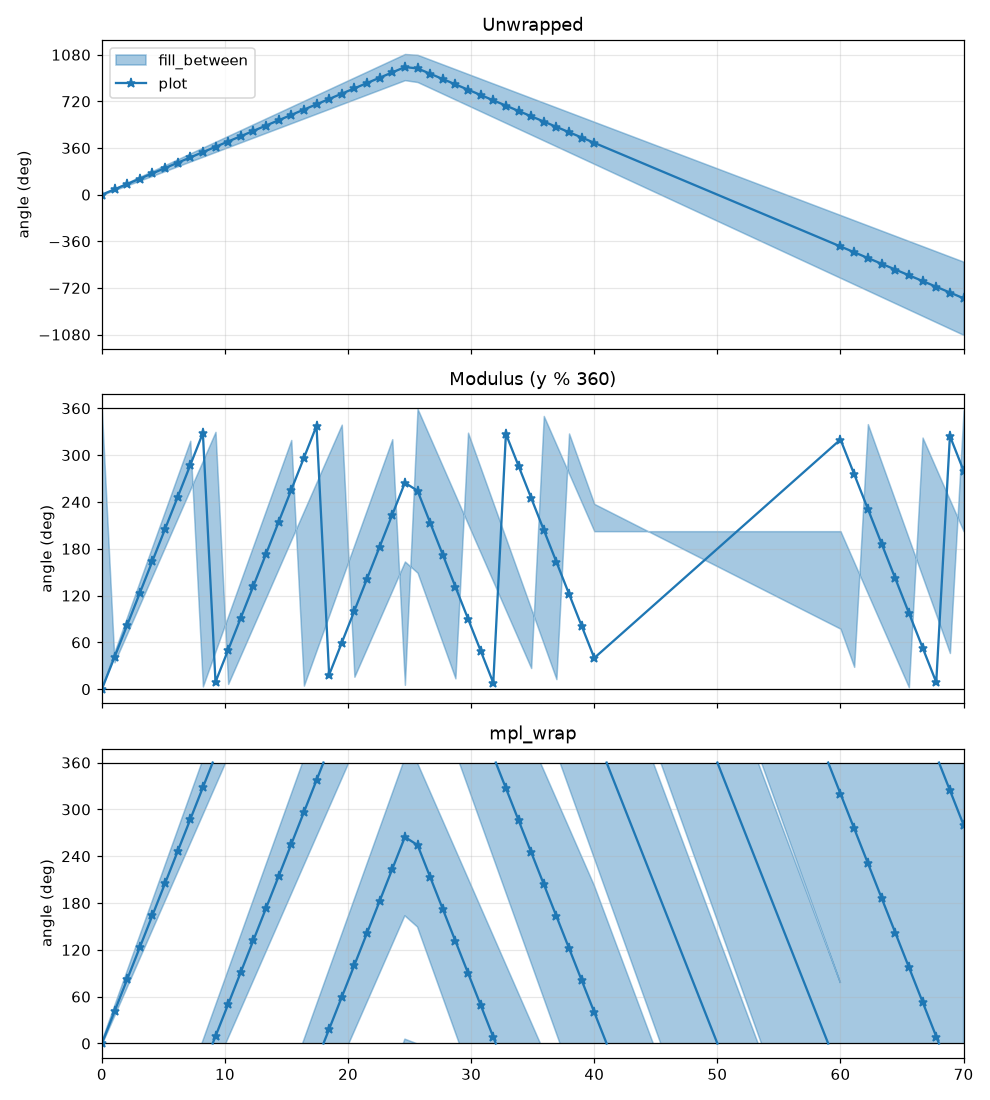
Manually plotting this data can be tricky. Using a modulus such as y % 360 is simple,
but introduces a few problems:
- Line jumps at the crossing points, and lines that stop short of the wrap boundaries at the crossing points
- Aliasing when data spans multiple crossings, obscuring the real underlying behavior
- Completely broken rendering for fill_between
mpl_wrap solves these issues, and provides simple functions to make plotting wrapped
data easy.
pip install mpl_wrap
Or install from source:
git clone https://github.com/scottshambaugh/mpl_wrap.git
cd mpl_wrap
uv sync --group dev
import numpy as np
import matplotlib.pyplot as plt
from mpl_wrap import set_wrap, plot_wrapped, fill_between_wrapped, errorbar_wrapped

t = np.linspace(0, 10, 500)
angle = 80.0 * t  # degrees
width = 5.0 + 4.0 * t  # degrees

fig, ax = plt.subplots()
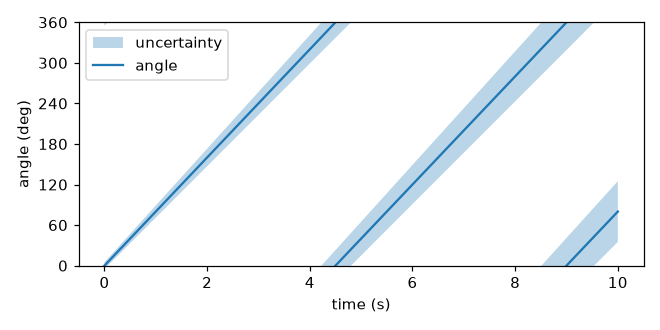
set_wrap(ax, wrapy=(0, 360))  # helpers on ax now wrap y into (0, 360)
fill_between_wrapped(ax, t, angle - width, angle + width, alpha=0.3, label='uncertainty')
plot_wrapped(ax, t, angle, label='angle')
ax.set(xlabel="time (s)", ylabel="angle (deg)")
ax.legend()
The helpers mirror their matplotlib counterparts, taking the target Axes as
the first argument plus optional wrapx / wrapy (min, max) windows:
| mpl_wrap | mirrors |
|---|---|
plot_wrapped(ax, x, y, ...) |
ax.plot |
scatter_wrapped(ax, x, y, ...) |
ax.scatter |
hlines_wrapped(ax, y, xmin, xmax) |
ax.hlines |
vlines_wrapped(ax, x, ymin, ymax) |
ax.vlines |
axhspan_wrapped(ax, ymin, ymax) |
ax.axhspan |
axvspan_wrapped(ax, xmin, xmax) |
ax.axvspan |
fill_between_wrapped(ax, x, y1, y2) |
ax.fill_between |
fill_betweenx_wrapped(ax, y, x1, x2) |
ax.fill_betweenx |
step_wrapped(ax, x, y, where=...) |
ax.step |
stairs_wrapped(ax, values, edges) |
ax.stairs |
errorbar_wrapped(ax, x, y, yerr, xerr) |
ax.errorbar |
Each returns the same artist type as the method it mirrors, in the same Axes
container. The two span helpers return a list of Rectangle, since a band
across the seam is two rectangles.
Passing wrapx=False / wrapy=False disables wrapping for a single call (or
clears the stored window when passed to set_wrap), and wrapx=True /
wrapy=True requires the stored window.
set_wrap also sets the axis limits to the window by default, and ticks the
window evenly so that ticks land exactly on the window edges, at about the
automatic tick density. Opt out with set_lims=False / edge_ticks=False,
or pass seam_lines=True to mark the window edges with lines.
You must pass the original unwrapped data for these to work.
If your data is already wrapped, np.unwrap may be able to recover that if it's sampled at a high enough rate.
The helpers are free functions, and are also available as methods on an
AxesWrap axes. These three are equivalent:
from mpl_wrap import set_wrap, plot_wrapped, wrap_axes

# 1. Free functions, on any existing axes
fig, ax = plt.subplots()
set_wrap(ax, wrapy=(0, 360))
plot_wrapped(ax, t, angle)

# 2. Methods on an AxesWrap axes, created with the "wrap" projection
fig, ax = plt.subplots(subplot_kw={"projection": "wrap"})
ax.set_wrap(wrapy=(0, 360))
ax.plot_wrapped(t, angle)

# 3. Methods on an existing axes, upgraded in place from Axes to AxesWrap
fig, ax = plt.subplots()
wrap_axes(ax, wrapy=(0, 360))
ax.plot_wrapped(t, angle)
The data processing is also exposed on its own: wrap_line and wrap_points
take data plus windows and return the wrapped arrays without plotting anything
(also available as AxesWrap methods).
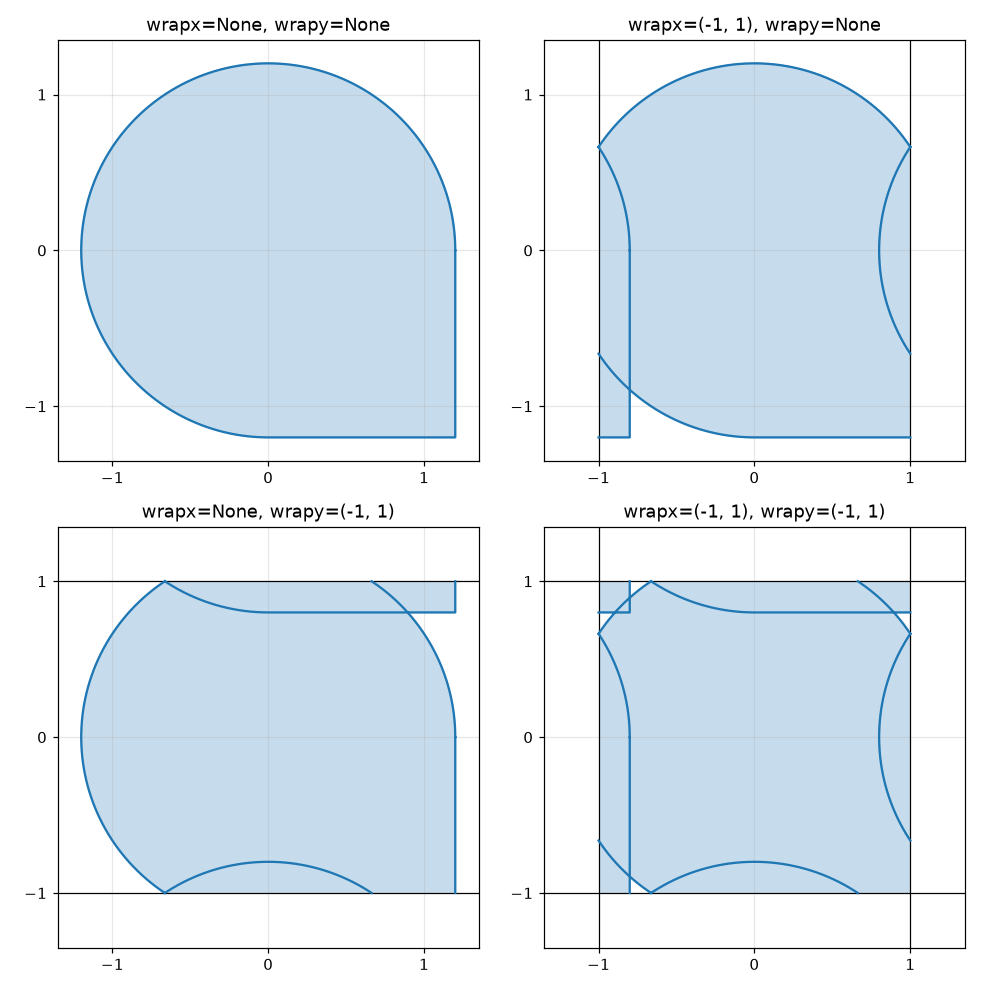
Both axes can be wrapped independently or together:
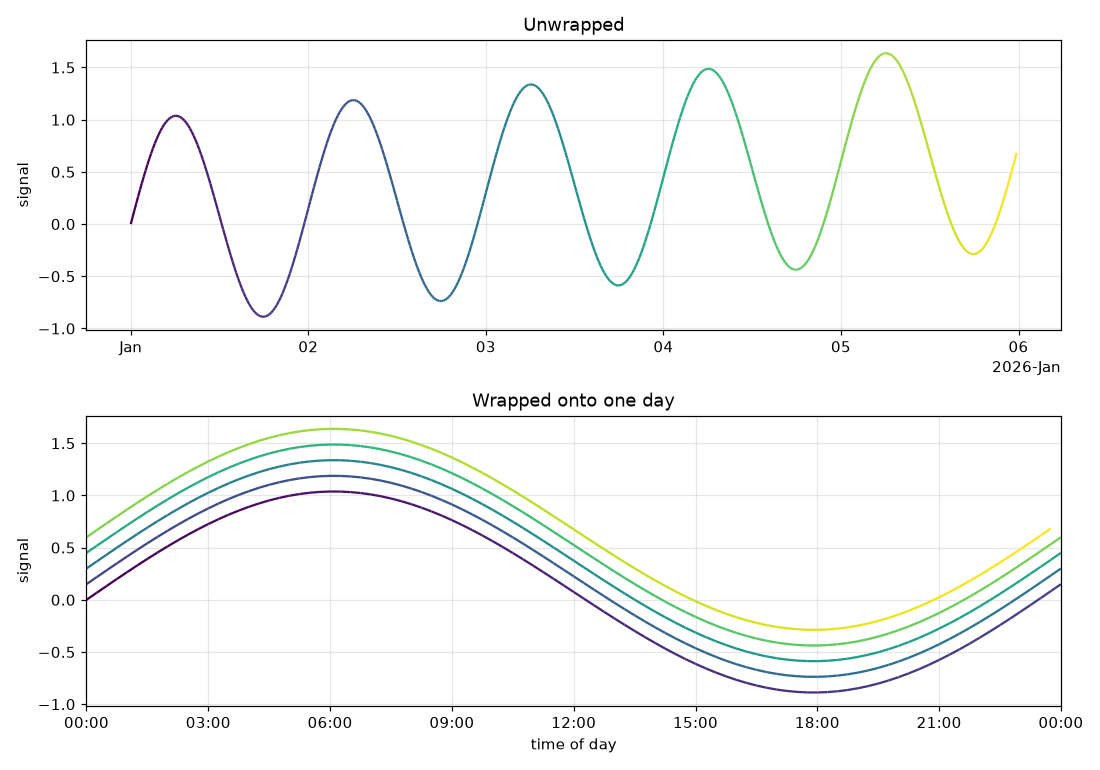
Datetime data and windows work on either axis. Here a five-day series is wrapped to show a time-of-day view:
set_wrap(ax, wrapx=(t0, t0 + np.timedelta64(1, "D")))
plot_wrapped(ax, times, signal)
Windows that are multiples of π/2 are automatically detected and labeled with ticks that are fractions of π.
set_wrap(ax, wrapy=(-np.pi, np.pi))
plot_wrapped(ax, t, angle)