


A skin (website theme) for the weewx weather software, modeled after my website BelchertownWeather.com.
- A chart builder: pick what to plot and see the chart drawn from your own data, then copy the settings into your charts file. No more writing chart configuration by hand (see Chart builder).
- Live updates on the home page without reloading, if you set up MQTT (see Live updates).
- Charts you can customize: which observations, what time range, how they're grouped.
- Light and dark mode, switching automatically at sunrise and sunset if you like.
- Forecasts, air quality and (in the US) weather alerts with no setup, from Open-Meteo and the National Weather Service; Xweather optional.
- Your nearest recent earthquake, plus weather records for this year and all time, the all-time records broken this year, and how today's date has gone in every year since your station started.
- Works on phones and tablets, and can be added to a phone's home screen like an app.


Important
Belchertown 3 requires weewx 5.0 or newer. On weewx 3 or 4, use Belchertown 1.3.1. Coming from 1.3.1? The wiki has an upgrade guide.
This is the original Belchertown skin, back in active development and refactored from the ground up: a chart builder that writes your chart settings for you, faster pages, a new home page and records page, forecasts and alerts with no setup, and a °F/°C button, all on weewx 5. See the changelog for everything that changed.
Note
Why 3.0 and not 2.0? While this skin was quiet, uajqq kept it going as New Belchertown, a separate fork with its own 2.x versions. The two are different skins, so this one jumps from 1.3.1 straight to 3.0 to keep the version numbers apart. Both are free; use whichever suits you.
- Quick start
- Make it yours: site title and text, metric units, logo, theme, what's on the home page, your own pages and content
- Forecasts
- Live updates (MQTT)
- Charts
- All skin options
- Wall display (kiosk view)
- Troubleshooting and FAQ
- Development version
- Donate and Credits
These steps get you a working site. Everything after this section is optional.
1. Download the latest weewx-belchertown-x.x.x.tar.gz from the releases page.
2. Install it. Replace x.x.x with the version you downloaded:
weectl extension install weewx-belchertown-x.x.x.tar.gz
3. Check your station's location. Open your weewx.conf (see the table below) and make sure the [Station] section has your latitude and longitude. The forecast, earthquakes and sunrise/sunset all use them.
Where's my weewx.conf? It depends on how you installed weewx:
| How weewx was installed | weewx.conf | Belchertown files | weewx's website folder |
|---|---|---|---|
Package (apt, yum, dnf) |
/etc/weewx/weewx.conf |
/etc/weewx/skins/Belchertown |
/var/www/html/weewx |
pip |
~/weewx-data/weewx.conf |
~/weewx-data/skins/Belchertown |
~/weewx-data/public_html |
4. Choose where the site goes. The installer sets HTML_ROOT = belchertown in the [[Belchertown]] section, which puts the site in a belchertown folder next to weewx.conf, where your web server probably can't see it. Change it to a folder inside your website, for example:
    [[Belchertown]]
        skin = Belchertown
        HTML_ROOT = /var/www/html/weewx/belchertown
5. Restart weewx:
sudo systemctl restart weewx
6. Wait for the next archive period (how often weewx saves a record, usually every 5 minutes), or build the site right away with:
weectl report run
7. Open your website at the matching address, for example http://your-server/weewx/belchertown. To make it your main page, see Make Belchertown your main website.
Most settings go in weewx.conf, in the [[Belchertown]] section under [StdReport]. Put them there rather than in the skin's own skin.conf, because skin.conf is replaced when you upgrade the skin and your changes would be lost.
Here is a complete example. [[[Extras]]] holds options and [[[Labels]]] holds text:
[StdReport]
    [[Belchertown]]
        skin = Belchertown
        HTML_ROOT = /var/www/html/weewx/belchertown
        [[[Extras]]]
            logo_image = "https://example.com/my-logo.png"
            theme = auto
            forecast_enabled = 1
            forecast_api_id = "your_id"
            forecast_api_secret = "your_secret_key"
            earthquake_enabled = 1
        [[[Labels]]]
            [[[[Generic]]]]
                home_page_header = "Belchertown Weather Conditions"
                footer_copyright_text = "My Weather Website"
Restart weewx after any change. Every option is listed in All skin options.
Every piece of text on the site is a "label" you can change or translate. To change one, copy it into [[[Labels]]] → [[[[Generic]]]] as in the example above. The full list is in skin.conf under [Labels] → [[Generic]]. The most common ones:
| Label | Default | What it is |
|---|---|---|
| home_page_header | "My Station Weather Conditions" | Heading on the Home page |
| graphs_page_header | "Weather Observation Graphs" | Heading on the Graphs page |
| reports_page_header | "Weather Observation Reports" | Heading on the Reports page |
| records_page_header | "Weather Observation Records" | Heading on the Records page |
| about_page_header | "About This Weather Station" | Heading on the About page |
| powered_by | "Observations are powered by a Personal Weather Station" | Text in the header |
| footer_copyright_text | "My Weather Website" | Text after the year in the footer's copyright |
| footer_disclaimer_text | "Never make important decisions from this website." | Disclaimer in the footer |
The skin also ships in Catalan, German, French and Italian: add lang = ca, lang = de, lang = fr or lang = it under [[Belchertown]].
Dates and times in your language
Dates and times are formatted in the browser by Day.js, using your server's locale and timezone. Day.js uses the same format codes as moment.js, which earlier versions of the skin used, so formats you set before still work. The formats are labels too (look for the moment.js section under [Labels] in skin.conf). If a date looks wrong for your locale, set the right locale and timezone on your weewx server and restart it, or write the format out yourself. For example, Wednesday 15 May 20:25 is dddd DD MMM HH:mm:
ddddis the full day name (Saturday);dddis the short one (Sat)DDis the day with a leading zero (05);Dwithout (5)MMMis the short month (Jan);MMMMthe full one (January)HHis the 24-hour hour with a leading zero (02);Hwithoutmmis the minute with a leading zero (08);mwithout
Belchertown uses whatever units weewx is set to. To switch everything to metric, add this to weewx.conf and restart weewx:
[StdReport]
    [[Defaults]]
        [[[Units]]]
            [[[[Groups]]]]
                group_altitude = meter
                group_degree_day = degree_C_day
                group_pressure = mbar
                group_distance = km
                group_rain = mm
                group_rainrate = mm_per_hour
                group_speed = meter_per_second
                group_speed2 = meter_per_second2
                group_temperature = degree_C
The weewx documentation lists the other units you can choose. The forecast has its own unit setting: see Forecast units.
Set logo_image (and optionally logo_image_dark for dark mode) in [[[Extras]]] to the full web address of your logo. About 330 pixels wide by 80 pixels high fits best. Without a logo, the site shows site_title instead.
Set theme in [[[Extras]]] to light, dark or auto. Auto switches to light at sunrise and dark at sunset, using your station's latitude and longitude.
Visitors can flip between light and dark with the switch next to the menu. That choice lasts until they close the tab, even when your theme is auto. You can also force a theme with the address: add ?theme=dark, ?theme=light or ?theme=auto to the end, for example http://your-server/weewx/belchertown/?theme=dark.
To make Belchertown the main site and move weewx's standard pages into a weewx subfolder:
- In
weewx.conf, under[StdReport], changeHTML_ROOTto/var/www/html/weewx(or wherever your website lives, plus/weewx). - Under
[[Belchertown]], setHTML_ROOTto your website's main folder:
    [[Belchertown]]
        skin = Belchertown
        HTML_ROOT = /var/www/html
- Optional but recommended: empty the website folder so Belchertown starts clean.
- Restart weewx and wait for the next archive period.
Your About and Records pages can contain your own text (HTML is fine). In the Belchertown files folder (where is it?), copy about.inc.example to about.inc and records.inc.example to records.inc, edit them, and wait for the next archive period. Upgrades don't overwrite these files, but keep a backup anyway.
The home page is made of five blocks:
conditions: the current temperature, wind, station readings, sun and moon, and the radarforecast: the forecastonthisday: today compared with the same date in every past year: the record low and high, the average, and a note when today is unusual, such as "Coldest October 7 on record so far". It appears once your station has data from at least one earlier year.snapshot: today's and this month's highs, lows, wind and rain, and the latest nearby earthquakecharts: the charts
home_sections lists them in the order they appear. To reorder them, change the order; to hide one, leave it out. For example, to put the forecast first and drop the snapshot, add this to [[[Extras]]] in weewx.conf:
        [[[Extras]]]
            home_sections = forecast, conditions, charts
You can also add your own block, such as a webcam picture or a note to visitors. Make up a name, put it in home_sections, and create a file called home_ plus that name plus .inc in the Belchertown files folder. For example, with home_sections = conditions, webcam, forecast, snapshot, charts, the skin shows the contents of home_webcam.inc between the conditions and the forecast. HTML is fine, and weewx tags such as $current.outTemp work too.
Visitors can pick how the home page is laid out with the layout button (the four squares next to the sun/moon button):
- Dashboard: everything in the order of
home_sections. This is the normal layout. - Forecast first: the forecast at the top, with the current conditions under it.
- Radar first: a big radar across the top, with the current conditions under it.
- Charts first: the charts at the top of the page.
The choice is remembered in that visitor's browser, so it's still there next time. To change what everyone sees on their first visit, set home_view in [[[Extras]]]:
        [[[Extras]]]
            home_view = radar
Storm mode switches to Radar first by itself while it's raining at your station, or while an alert about storms, thunder, tornadoes, floods, hurricanes, rain, snow, sleet or ice is in effect, and switches back afterwards. Alerts about frost, heat, wind, fog or air quality don't trigger it, since the radar doesn't help with those. It only applies to visitors who haven't picked a layout themselves. To turn it off, set storm_view = 0 in [[[Extras]]].
You can also link straight to a layout by adding ?view= and its name to your home page address, for example http://your-server/weewx/belchertown/?view=charts. The wall display uses the same idea with ?view=kiosk.
The header has a units button that shows the temperature unit on screen, such as °F. Pressing it shows the whole site in the other system: °F and °C, mph and km/h, inches and millimeters (rain, rain rate and snow), inHg and hPa, miles and kilometers, feet and meters, and degree days. Everything on the page changes, including the forecast, the records, live updates and the charts. Each visitor's choice is remembered in their browser; your station keeps its own units, and visitors who never press the button see those.
The NOAA reports on the Reports page stay in your station's units. To hide the button, set unit_toggle_enabled = 0 in [[[Extras]]].
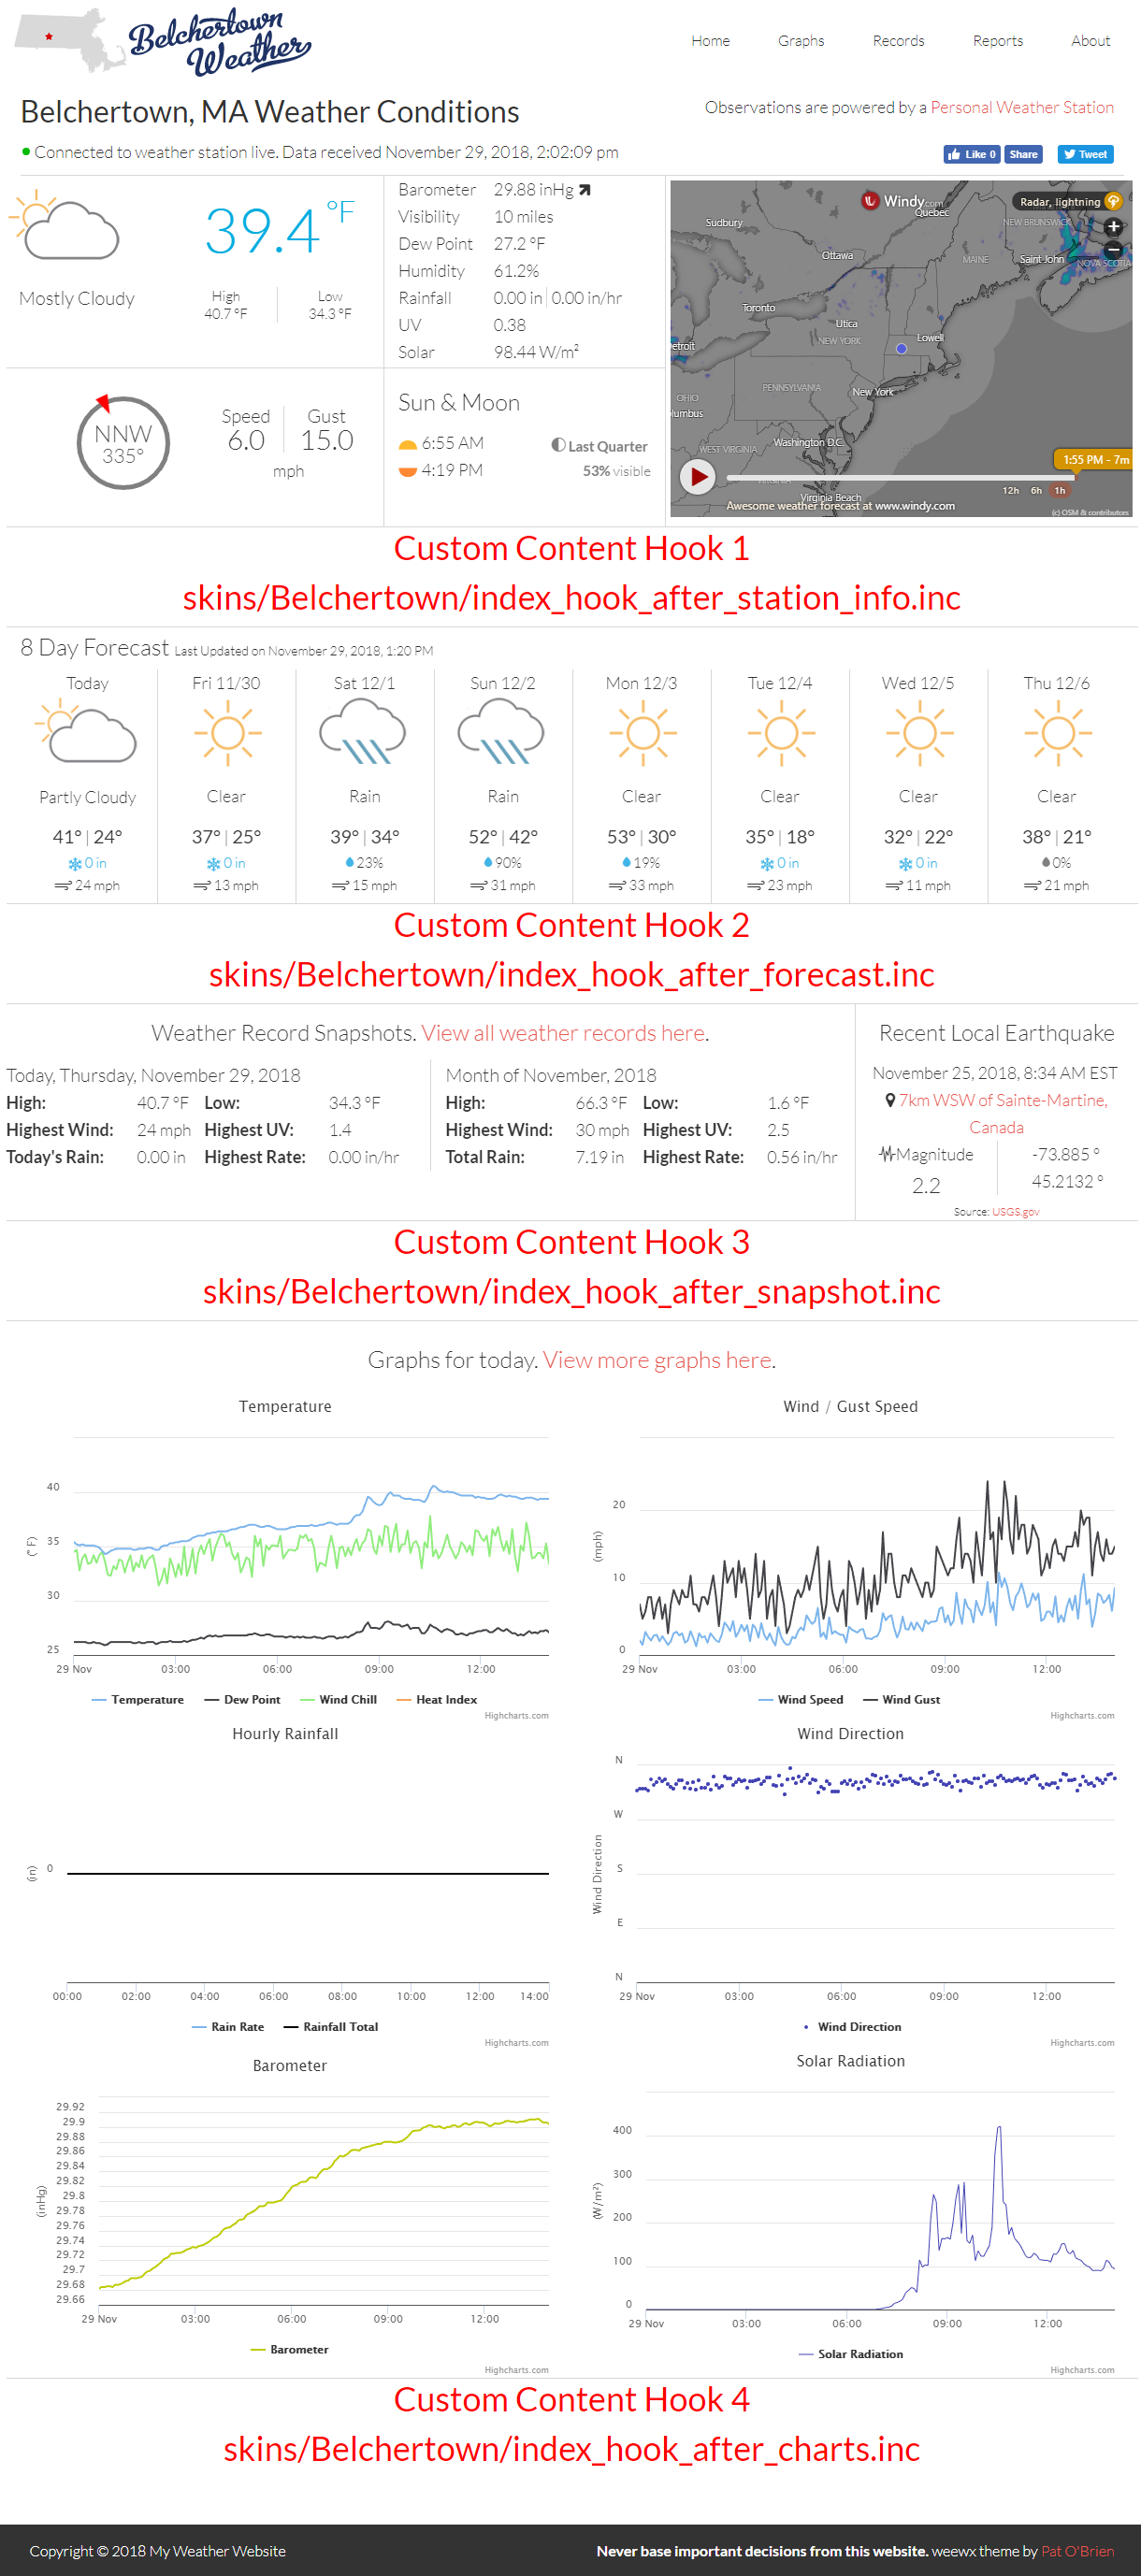
There are also four fixed places for your own content (HTML is fine). Create any of these files in the Belchertown files folder:
- Below the station info:
index_hook_after_station_info.inc - Below the forecast:
index_hook_after_forecast.inc - Below the records snapshot:
index_hook_after_snapshot.inc - Below the charts:
index_hook_after_charts.inc
To change the look and keep your changes across upgrades, create a custom.css file in your website folder. It's loaded after the skin's own styles.
Since version 3.0 the skin no longer uses jQuery, so pages load faster. Older custom files (index_radar.inc, index_hook_after_*.inc, home_*.inc and the like) often do use it, so the skin checks your .inc files each time it builds the site:
- None of them use jQuery: it isn't loaded at all. Nothing to do.
- One of them does: jQuery and Bootstrap's scripts are loaded for it, so your page keeps working, and the weewx log says which file, for example:
index_radar.inc uses jQuery, so jQuery is loaded for it.Your site is fine as it is; updating that file just makes the page a little lighter.
Tabs and popups written the Bootstrap way (data-toggle="tab", data-toggle="modal") work without jQuery, so you can leave those as they are.
The skin no longer loads the Bootstrap stylesheet either; it has its own copy of the few Bootstrap styles it uses. If one of your .inc files uses other Bootstrap classes (such as col-md-4, text-center, img-responsive or panel), the full Bootstrap stylesheet is loaded for it and the weewx log names the file and the classes, the same way as for jQuery. To always load it, or never, set bootstrap = 1 or bootstrap = 0 in [[[Extras]]]. The examples that come with the skin (index_radar.inc.example, records-table.inc.example) show the jQuery-free way to do the usual things.
Updating a file that uses jQuery
These are the most common jQuery lines and what to write instead:
| jQuery | Without jQuery |
|---|---|
jQuery(document).ready(function() { ... }); |
document.addEventListener("DOMContentLoaded", function() { ... }); |
jQuery(".high").html("72°"); |
document.querySelectorAll(".high").forEach(el => el.innerHTML = "72°"); |
jQuery("#cam img").attr("src", url); |
document.querySelector("#cam img").src = url; |
jQuery(".box").hide(); / .show(); |
el.style.display = "none"; / el.style.display = ""; |
jQuery(".box").css("color", "red"); |
el.style.color = "red"; |
jQuery.getJSON(url, function(data) { ... }); |
fetch(url).then(r => r.json()).then(function(data) { ... }); |
If you'd rather not change anything, that's fine too. To always load jQuery (with Bootstrap's scripts), or never, set jquery = 1 or jquery = 0 in [[[Extras]]].
Help search engines find your site (sitemap.xml)
weewx can't build a sitemap by itself. My sitemap generator crawls your site and writes one; run it on your web server from cron to keep it current. Online tools such as xml-sitemaps.com work too. The NOAA reports change often, so update the sitemap regularly if search ranking matters to you.
Submit the sitemap's address to Google Search Console and Bing Webmaster Tools, then add this line to the bottom of the skin's robots.txt and restart weewx:
Sitemap: http://YOURWEBSITE/sitemap.xml
The forecast works out of the box. With no setup at all, the current conditions, the 7-day, 3-hour and 1-hour forecasts and the air quality come from Open-Meteo, which is free, needs no account and covers the whole world.
Weather alerts (watches and warnings) also work with no setup in the US: they come from the National Weather Service. Outside the US there are no alerts unless you use Xweather.
Other forecast sources are optional:
-
National Weather Service (US only, free, no key): set
forecast_provider = nwsto use the NWS forecast itself, the one on weather.gov. -
Xweather (formerly AerisWeather): needs a free key, and brings its own alerts, including outside the US where Xweather covers them. There are two ways to get a key:
- Xweather's free tier (US and Canada): the first 15,000 calls each month are free, with no credit card. The skin uses roughly 7,000 a month with everything turned on. Sign up here.
- The PWSweather contributor plan (anywhere): free if you send your station's data to PWSweather, which weewx can do for you with the
[[PWSweather]]section under[StdRESTful]inweewx.conf. Sign up here with your PWSweather login.
Then copy your client ID and secret from your Xweather account into
[[[Extras]]]. As soon as a key is there, the skin uses Xweather instead of Open-Meteo:
        [[[Extras]]]
            forecast_api_id = "your_id"
            forecast_api_secret = "your_secret_key"
The skin downloads a new forecast about once an hour. forecast_provider chooses the source: auto (the default: Xweather when a key is set, otherwise Open-Meteo), openmeteo, nws or aeris (Xweather). forecast_alert_provider does the same for alerts: auto (Xweather's alerts with Xweather, otherwise the National Weather Service), nws, aeris or none. Air quality comes from Xweather with Xweather, and from Open-Meteo otherwise. To turn the forecast off, set forecast_enabled = 0; to turn only the alerts off, set forecast_alert_enabled = 0. More settings are under "Forecast options" in All skin options.
For developers: the forecast.json file
The skin writes the forecast to json/forecast.json in the same format whatever the source, so other programs can read it. Values are already in the units forecast_units asks for (listed under units); wind is also given in knots. The format is described at the top of bin/user/belchertown_forecast.py, and belchertown_forecast is its version number (3).
The forecast's units are set separately with forecast_units:
us: US units (the default)si: metric. Temperature in °C, wind in meters per second, visibility in kilometersca: same assi, but wind in kilometers per houruk2: same assi, but wind in miles per hour and visibility in miles
The forecast arrives as weather codes, and each code has a label, so the forecast can be translated like any other text. Look for the forecast_ labels in skin.conf and copy the ones you want to change into weewx.conf (how).
Normally the site updates once per archive period. With live updates, the home page changes every few seconds without reloading.
It works with MQTT, a small messaging system. weewx sends each new reading to an MQTT server (a "broker"), and visitors' browsers listen to the broker over websockets (a connection that stays open). You need:
- A broker. Run your own or use a public one; see Brokers below.
- The weewx-mqtt extension, so weewx sends its data to the broker. A sample configuration for it (change
server_url,topicandunit_system; delete the[[[tls]]]part if your broker doesn't use SSL):
    [[MQTT]]
        server_url = mqtt://username:password@mqtt.hostname:port/
        topic = the/topic/to/publish/to
        unit_system = US
        binding = archive, loop
        aggregation = aggregate
        [[[tls]]]
            tls_version = tlsv1
            ca_certs = /etc/ssl/certs/ca-certificates.crt
- The skin settings, in
[[[Extras]]]. The port here is the broker's websockets port, not its regular MQTT port:
        [[[Extras]]]
            mqtt_websockets_enabled = 1
            mqtt_websockets_host = "mqtt.hostname"
            mqtt_websockets_port = 8080
            mqtt_websockets_ssl = 1
            mqtt_websockets_topic = "the/topic/to/publish/to/loop"
When weewx saves a new archive record, the page also reloads its forecast, earthquake and chart data. Questions about the weewx-mqtt extension itself go to the weewx-user group; I didn't write it.
Run your own. These are my instructions for setting up a broker. A small DigitalOcean server is a quick and easy place to run one, and signing up with this referral link gets you free credit and helps pay for my server:

Use a public one. These have worked with MQTT and websockets (if you know others, let me know):
The wiki has a step-by-step guide to setting up live updates with your own Mosquitto broker, including the https case and a troubleshooting list, and a page on public brokers with ready-to-paste settings.
You control which charts appear, what they show and over what time range, in a graphs.conf file. The skin ships with five groups of charts to start from (home page, today, this week, this month, this year). Everything you can do is on the chart wiki page.

The easiest way to add a chart is the chart builder: a page on your own site where you pick what to show and see the chart drawn from your station's data as you go. It gives you the text to paste into graphs.conf.
- Open
chart-builder/on your site, for examplehttps://www.example.com/chart-builder/(orhttps://www.example.com/weather/chart-builder/if your weather pages live in a folder). It isn't in the menu, so bookmark it. - Give the chart a title, then choose the kind of chart, how much time it covers and how much detail. Under Lines, choose what to plot; Add a line puts more on the same chart. Tick Right-hand scale for a line measured in something different, such as rain on a temperature chart.
- Under Where it goes, pick the page of charts it belongs on, or A new page of charts.
- Press Copy and follow the steps under the text: paste it into
graphs.conf(in your Belchertown skin folder), save, and the chart shows up after the next report. There's no need to restart weewx.
The page only reads your data and can't change anything on your server, so it needs no password. Search engines are asked not to list it. The data behind it (json/chart_builder.json) is written by the first report and refreshed once an hour. To turn it off, set chart_builder_enabled = 0.
These go in weewx.conf under [[Belchertown]] → [[[Extras]]] (example). Click a group to open it.
General options
| Name | Default | Description |
|---|---|---|
| belchertown_debug | 0 | 1 turns on debug messages in the browser console. See Debug mode. |
| belchertown_locale | "auto" | The language and number format, like "en_US.UTF-8" or "de_DE.UTF-8". "auto" uses your server's setting. The locale must be installed on your server first. |
| theme | light | light, dark or auto (light at sunrise, dark at sunset). |
| theme_toggle_enabled | 1 | Shows a moon/sun button so visitors can flip between light and dark. |
| jquery | auto | Loads jQuery only when one of your own .inc files uses it. 1 always loads it, 0 never does. See Your own scripts, jQuery and Bootstrap. |
| bootstrap | auto | Loads Bootstrap's stylesheet only when one of your own .inc files uses Bootstrap classes the skin doesn't style. 1 always loads it, 0 never does. |
| chart_builder_enabled | 1 | Writes the data for the chart builder page once an hour. 0 turns it off. |
| back_to_top_button_enabled | 0 | 1 shows a "back to top" button once the page is scrolled. |
| back_to_top_button_position | 0 | 0 puts the button on the right, 1 on the left. |
| back_to_top_button_opacity | 0.8 | How solid the button is, from 0.1 (faint) to 1.0. |
| sticky_header | 1 | Keeps the header (logo, menu and buttons) at the top of the screen while scrolling; it slims down once you scroll. 0 lets it scroll away with the page. |
| unit_toggle_enabled | 1 | Shows a units button (°F or °C) so visitors can see the site in the other unit system. See Units button. |
| logo_image | "" | The full web address of your logo. About 330 × 80 pixels fits best. |
| logo_image_dark | "" | The full web address of a logo for dark mode. |
| site_title | "My Weather Website" | Shown instead of a logo when logo_image is empty. |
| station_observations | "barometer", "dewpoint", "outHumidity", "rainWithRainRate" | Which observations are listed next to the radar, in order. Use weewx database names, plus aqi, visibility and cloud_cover (from the forecast provider) and rainWithRainRate (rain total and rate on one line). To read from another database, add the binding, for example leafTemp2(data_binding=sdr_binding); if that observation isn't in the live MQTT data it only updates when the page reloads. |
| beaufort_category | 0 | Shows the Beaufort category ("calm", "gale", ...) under wind speed. For live updates, add beaufort = prefer_hardware under [StdWXCalculate] → [[Calculations]] in weewx.conf. |
| manifest_name | "My Weather Website" | Your site's name when someone adds it to their phone's home screen. |
| manifest_short_name | "MWW" | The name under its home screen icon. |
| radar_html | "" (a windy.com map) | The radar for light mode (and dark mode, if radar_html_dark isn't set). Any HTML, about 650 × 360 pixels. To make your own from windy.com, open Weather Radar there and choose "embed widget on page". |
| radar_html_dark | "" | The radar for dark mode. Any HTML. |
| radar_width | 650 | Width of the windy.com radar, in pixels. Your own radar_html sets its own size. |
| radar_height | 360 | Height of the windy.com radar, in pixels. |
| radar_zoom | 8 | How far the radar starts zoomed in, from 1 (far) to 11 (close). |
| radar_marker | 0 | 1 puts a marker at your station on the windy.com radar. |
| radar_overlay | radar | What the windy.com map shows: radar, wind, gust, rain, temp, clouds, satellite, pressure, rh, snowcover, thunder and the other layer names windy.com offers. |
| almanac_extras | 1 | Shows extra sun and moon details. Requires the ephem Python package on your server. |
| highcharts_enabled | 1 | 0 hides the charts. |
| home_sections | conditions, forecast, onthisday, snapshot, charts | The blocks on the home page, in order. Leave one out to hide it, or add your own. See Choose what's on the home page. |
| home_view | dashboard | The home page layout visitors see first: dashboard, forecast, radar or charts. See Home page layouts. |
| storm_view | 1 | Storm mode: shows the radar first while it's raining or a storm alert is in effect. 0 turns it off. See Home page layouts. |
| graph_page_show_all_button | 1 | Adds an "All" button on the Graphs page that shows every chart, two per row. |
| graph_page_default_graphgroup | "day" | Which chart group the Graphs page opens with. "all" shows them all. |
| highcharts_homepage_graphgroup | "homepage" | Which chart group the home page shows. See the chart wiki. |
| highcharts_decimal | "auto" | The decimal point in charts. "auto" uses your locale's. |
| highcharts_thousands | "auto" | The thousands separator in charts. "auto" uses your locale's. |
| googleAnalyticsId | "" | Your Google Analytics ID, if you use it. |
| webpage_autorefresh | 0 | Without live updates, reload the page this often, in milliseconds (300000 = 5 minutes). 0 turns it off. |
| reload_hook_images | 0 | 1 reloads images in your home page content on the timers below. |
| reload_images_radar | 300 | Seconds between radar reloads. -1 turns it off. |
| reload_images_hook_asi | -1 | Seconds between reloads of images in index_hook_after_station_info.inc. -1 turns it off. |
| reload_images_hook_af | -1 | Seconds between reloads of images in index_hook_after_forecast.inc. -1 turns it off. |
| reload_images_hook_as | -1 | Seconds between reloads of images in index_hook_after_snapshot.inc. -1 turns it off. |
| reload_images_hook_ac | -1 | Seconds between reloads of images in index_hook_after_charts.inc. -1 turns it off. |
| show_last_updated_alert | 0 | Without live updates, shows a warning banner when the data is older than the next setting. |
| last_updated_alert_threshold | 1800 | Seconds before the data counts as old for that banner. |
Live update (MQTT) options
| Name | Default | Description |
|---|---|---|
| mqtt_websockets_enabled | 0 | 1 turns on live updates. |
| mqtt_websockets_host | "" | Your broker's hostname or IP address. |
| mqtt_websockets_port | 1883 | Your broker's websockets port. (1883 is the usual plain MQTT port; websockets is often 9001 or 8080. Check your broker.) |
| mqtt_websockets_username | "" | Username for the broker, if it needs one. |
| mqtt_websockets_password | "" | Password for the broker, if it needs one. Visitors' browsers receive it, so use a read-only account. |
| mqtt_websockets_ssl | 0 | 1 if your broker uses SSL. |
| mqtt_websockets_topic | "" | The topic to listen to, usually ending in /loop (for example weather/loop), to match your weewx-mqtt settings. |
| disconnect_live_website_visitor | 1800000 | Stop a visitor's live updates after this many milliseconds, so idle tabs don't stay connected forever. 1800000 = 30 minutes. 0 never disconnects. |
Forecast options
| Name | Default | Description |
|---|---|---|
| forecast_enabled | 1 | 1 shows the forecast. 0 turns it off. |
| forecast_provider | "auto" | Where the forecast comes from: openmeteo (free, no key, worldwide), nws (National Weather Service, US only, no key), aeris (Xweather, needs a key), or auto (Xweather when forecast_api_id is set, otherwise Open-Meteo). |
| forecast_api_id | "" | Your Xweather client ID. |
| forecast_api_secret | "" | Your Xweather client secret. |
| forecast_units | "us" | us, si, ca or uk2. See Forecast units. |
| forecast_stale | 3540 | Seconds before a new forecast is downloaded (3540 = 59 minutes). Each download costs about 10 Xweather calls (air quality counts 5), so going much below an hour can use up the free tier. |
| forecast_aeris_use_metar | 1 | Xweather only: 1 takes current conditions from airports and official stations; 0 from nearby personal weather stations. |
| forecast_interval_hours | 24 | Which forecast shows when someone opens the site: 1, 3 or 24 hours apart, or 0 to hide the forecast. |
| forecast_alert_enabled | 1 | 1 shows weather alerts (watches and warnings). They refresh with the forecast. 0 turns them off. |
| forecast_alert_provider | "auto" | Where alerts come from: nws (National Weather Service, US only, no key), aeris (Xweather), none, or auto (Xweather's alerts when the forecast is from Xweather, otherwise the National Weather Service). |
| forecast_alert_limit | 1 | How many alerts to show. |
| forecast_lang | "en" | The language of Xweather alert text (an Xweather language code). The forecast itself uses the skin's labels. |
| forecast_show_daily_forecast_link | 0 | 1 adds a link under each forecast day to the website in the next option. |
| forecast_daily_forecast_link | "" | The address for those links. YYYY, MM and DD are replaced with the day's date, for example https://live.xweather.com/local/us/ma/belchertown/forecast/YYYY/MM/DD. |
| forecast_show_humidity_dewpoint | 0 | Show humidity (1) or dew point (2) in the forecast. 0 shows neither. |
| aqi_enabled | 0 | 1 shows the Air Quality Index: from the nearest station within 50 miles with Xweather, otherwise modeled for your location by Open-Meteo. |
| aqi_location_enabled | 0 | Xweather only: 1 shows where that AQI reading comes from, which may be far away. |
Earthquake options
| Name | Default | Description |
|---|---|---|
| earthquake_enabled | 0 | 1 shows your nearest recent earthquake on the home page. |
| earthquake_maxradiuskm | 1000 | How far from your station to look, in kilometers. |
| earthquake_stale | 10740 | Seconds before downloading new earthquake data (10740 = just under 3 hours). Please keep it around 3 hours to be kind to the servers. |
| earthquake_server | USGS | USGS (best for North America), GeoNet (New Zealand) or ReNaSS (Europe). |
| geonet_mmi | 4 | GeoNet only: the smallest intensity to show (MMI, -1 to 8). 4 shows light quakes and stronger. |
Social sharing options
| Name | Default | Description |
|---|---|---|
| facebook_enabled | 0 | 1 shows a Facebook share button at the top of each page. |
| social_share_html | "http://yourwebsite" | The address people share, usually your home page. Set it, or the buttons share a dead link. |
To show your weather on a TV, tablet or a spare monitor, open your home page with ?view=kiosk added to the end of the address:
http://your-server/weewx/belchertown/?view=kiosk
That shows only the current conditions, sun and moon, radar and forecast, with no menu, records or charts, sized to fit a 1280 × 800 screen without scrolling. Live updates never time out in this view and reconnect on their own. Nothing needs to be turned on; it uses your normal settings.
You can force a theme too, which helps on a screen that's always on:
http://your-server/weewx/belchertown/?view=kiosk&theme=dark
Start the display automatically on a Raspberry Pi
On Raspberry Pi OS with the LXDE desktop, put this in /home/pi/.config/lxsession/LXDE-pi/autostart (change the address to yours):
@sed -i 's/"exited_cleanly":false/"exited_cleanly":true/' /home/pi/.config/chromium/Default/Preferences
@sed -i 's/"exit_type":"Crashed"/"exit_type":"Normal"/' /home/pi/.config/chromium/Default/Preferences
@chromium-browser --start-fullscreen --kiosk --disable-site-isolation-trials --enable-low-end-device-mode --renderer-process-limit=2 --app=http://your-server/weewx/belchertown/?view=kiosk
@unclutter -idle 0.1
Use a different MQTT broker for the display
If the display sits on the same network as your MQTT broker, it can connect to it directly instead of through the internet. Add these to [[[Extras]]]. Anything left empty uses the normal live update setting.
| Name | Default | Description |
|---|---|---|
| mqtt_websockets_host_kiosk | "" | The broker for the display, for example localhost or 192.168.1.10. |
| mqtt_websockets_port_kiosk | "" | Its websockets port. |
| mqtt_websockets_ssl_kiosk | "" | 1 if it uses SSL, 0 if not. |
Debug mode writes details about live updates, the theme, times and charts to your browser's console. Add ?debug=true to the end of your site's address (for example http://example.com/?debug=true), or set belchertown_debug = 1 and restart weewx. Then open your browser's developer console to read it.
Belchertown expects the wview-extended database layout that weewx has used since version 4. A database created before weewx 4 may be missing appTemp, and weewx 5 then calculates it on the fly, which is slow. Back up your database, then add the column and fill it in with weectl database add-column appTemp and weectl database calc-missing. Issue 924 has the details.
Do I have to use live updates, forecasts, earthquakes, the radar or the charts?
No. Everything beyond the basic install is optional. Leave a feature off and the site still works; it just updates once per archive period instead of live.
The units are wrong on the live-updated values.
The live values come from the weewx-mqtt extension, so set the units there. For example, to send today's rain in millimeters:
[[MQTT]]
        [[[inputs]]]
                [[[[dayRain]]]]
                        name = dayRain_mm
                        units = mm
My NOAA reports are blank.
Right after installing, give weewx a few archive periods to fill them in.
I see NAN in some places.
weewx hasn't collected enough data yet. Give it a few more archive periods.
Why does the skin take a while to build?
The charts read your whole database, from today back to the first record. A big database or a slow computer (like a Raspberry Pi) takes longer. Turning the charts off or using faster hardware helps.
The charts don't update right away after an archive period.
That's on purpose: the home page waits 30 seconds so the new chart data is ready. Only the home page updates live; the other pages show new data when reloaded.
The forecast's "Last Updated" time changes format when the page loads.
The page is built with your server's date format, and the browser then reformats it with Day.js. The two formats can differ slightly for some locales.
How can I tell whether new forecast or earthquake data was downloaded?
Check the weewx log for "forecast downloaded". Errors show up there too; earthquake downloads only appear with debug on.
How do I uninstall the skin?
weectl extension uninstall Belchertown
To try the newest changes before they're released, download the next branch and install it with weectl extension install next.zip, or copy its files over your skins/Belchertown and bin/user folders. Then restart weewx. The next branch is where the 3.0 rewrite happens, so expect rough edges.
This project took a lot of coffee to create. If you enjoy this skin and find some value from it, click here to buy me another cup of coffee :)
- Open-Meteo, the US National Weather Service and Xweather (formerly AerisWeather) for current conditions, forecasts, air quality and alerts.
- Windy.com for the embedded radar.
- Bootswatch Darkly for the Bootstrap dark mode.
- Highcharts Dark Unica for the chart dark mode.
- Gary, for help with the charts from version 0.1 through 0.9.1.
- Brian at weather34.com for the weather icons from the Simplicity 2015 theme, used with agreement.
- Some icons remixed by michaelundwd. Thanks!
- uajqq and the New Belchertown contributors, for keeping Belchertown alive between 2024 and 2026. Fixes from that fork are credited where they were used, such as michaelundwd's consecutive rain days fix.