This project implements a Snakemake pipeline for genomic biosurveillance of Phytophthora ramorum, the oomycete pathogen responsible for sudden oak death (SOD). The pipeline analyzes mitochondrial genome sequences to create interactive phylogenetic visualizations that monitor the emergence of new variants and clonal lineages of the SOD pathogen.
This the repository for the source code used to create the visualization which is hosted at https://nextstrain.org/community/grunwaldlab/SuddenOakDeathSurveillance.
To run the complete phylogenetic analysis pipeline, download/clone this repository, change into the resulting directory and run:
nextstrain build .This executes the Snakemake workflow and generates the final visualization file.
To view the interactive phylogenetic visualization:
nextstrain view auspice/Then open your browser to the displayed URL.
The repository includes a ~700 mitochondrial genomes of P. ramorum sampled between 1995 and 2019 from around the world. Only sequences associated with a known date and location were included in the analysis.
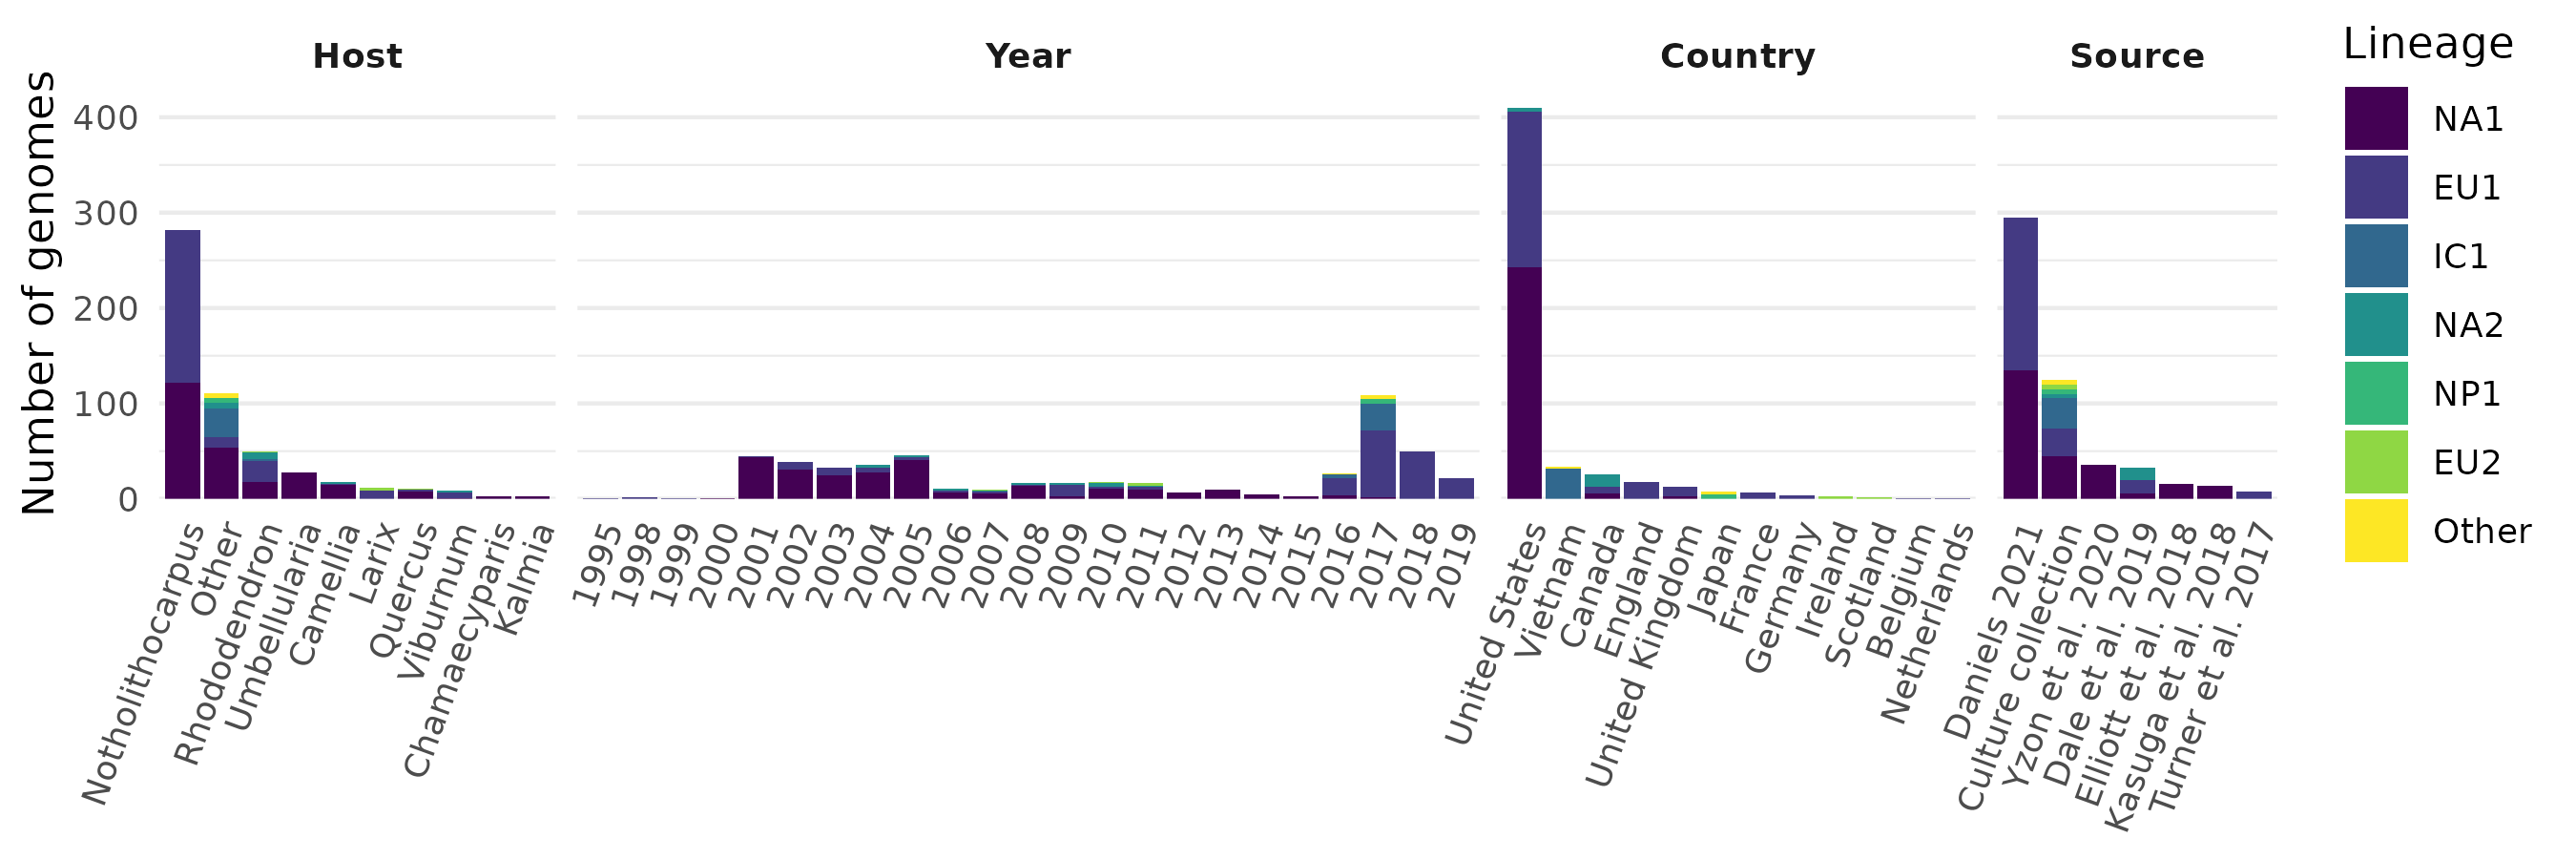
data/ramorum_mito_genomes.fasta- Assembled mitochondrial genome sequencesdata/formatted_metadata.tsv- Sample metadata (location, date, lineage, host species, etc.)data/martin2007_pr-102_v3.1_mito_ref.fasta- Reference mitochondrial genome for alignmentdata/MT_DQ832718.1.gb- Gene reference for translation and annotationdata/dropped_strains.txt- Sequences to exclude from analysisdata/colors.tsv- Color scheme for lineages and geographic regionsdata/lat_longs.tsv- Geographic coordinates for mappingdata/auspice_config.json- Auspice display configuration
The main output is auspice/SuddenOakDeathSurveillance.json, which contains all the data needed for visualization by auspice.
Intermediate results in results/ directory include filtered sequences, alignments, trees, and various node data files.
New mitochondrial genome data can be added by:
- Adding sequences to the input FASTA file
- Updating metadata with sample information
- Re-running the pipeline with
nextstrain build .
The visualization automatically updates when new data is processed through the pipeline.
- Zachary S. L. Foster¹
- Nicholas C. Cauldron²
- Caroline M. Press¹
- Valerie J. Fieland²
- Thomas Jung³
- Jared LeBoldus²
- Jeffrey H. Chang²
- Niklaus J. Grünwald¹
¹ Horticultural Crops Research Laboratory, USDA ARS, Corvallis, OR, USA
² Department of Botany and Plant Pathology, Oregon State University, Corvallis, OR, USA
³ Mendel University, Czech Republic
This project was supported by USDA-ARS CRIS Projects 2072-22000-041-00-D and 2072-22000-043-00-D, the USDA-ARS Floriculture Nursery Initiative, and the Phytophthora Diagnostics grant from USFS.